Solar & Wind Energy Management
Solar & Wind Energy Management
SWEM is a mission-critical platform designed for the real-time monitoring and management of large-scale solar and wind power plants.
Project Overview
// section.overview
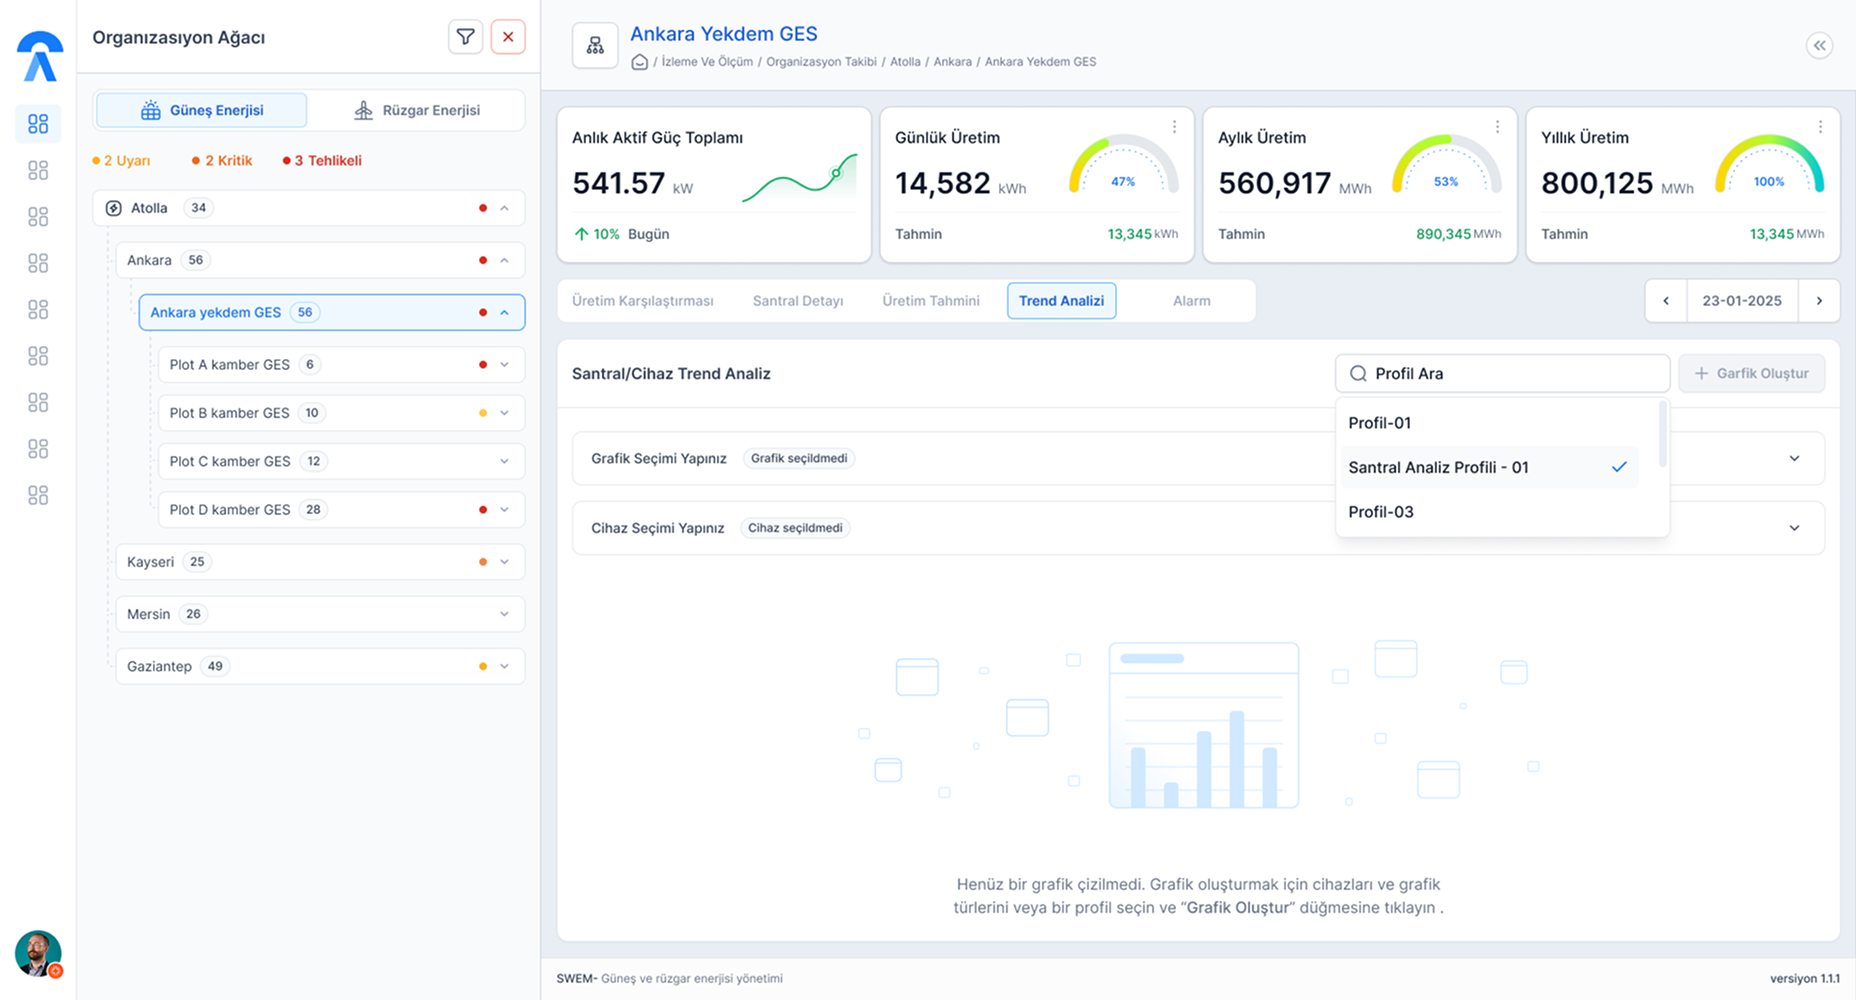
A Unified Command Center for National Renewable Energy
SWEM is a mission-critical platform designed for the real-time monitoring and management of large-scale solar and wind power plants. The system provides a unified interface for operators to track performance, manage maintenance schedules, and analyze energy production data — all in one place.

Project Problem
// section.problem
Manual processes were costing time, efficiency ,and operational stability.
Stakeholder Needs
// section.stakeholder.needs
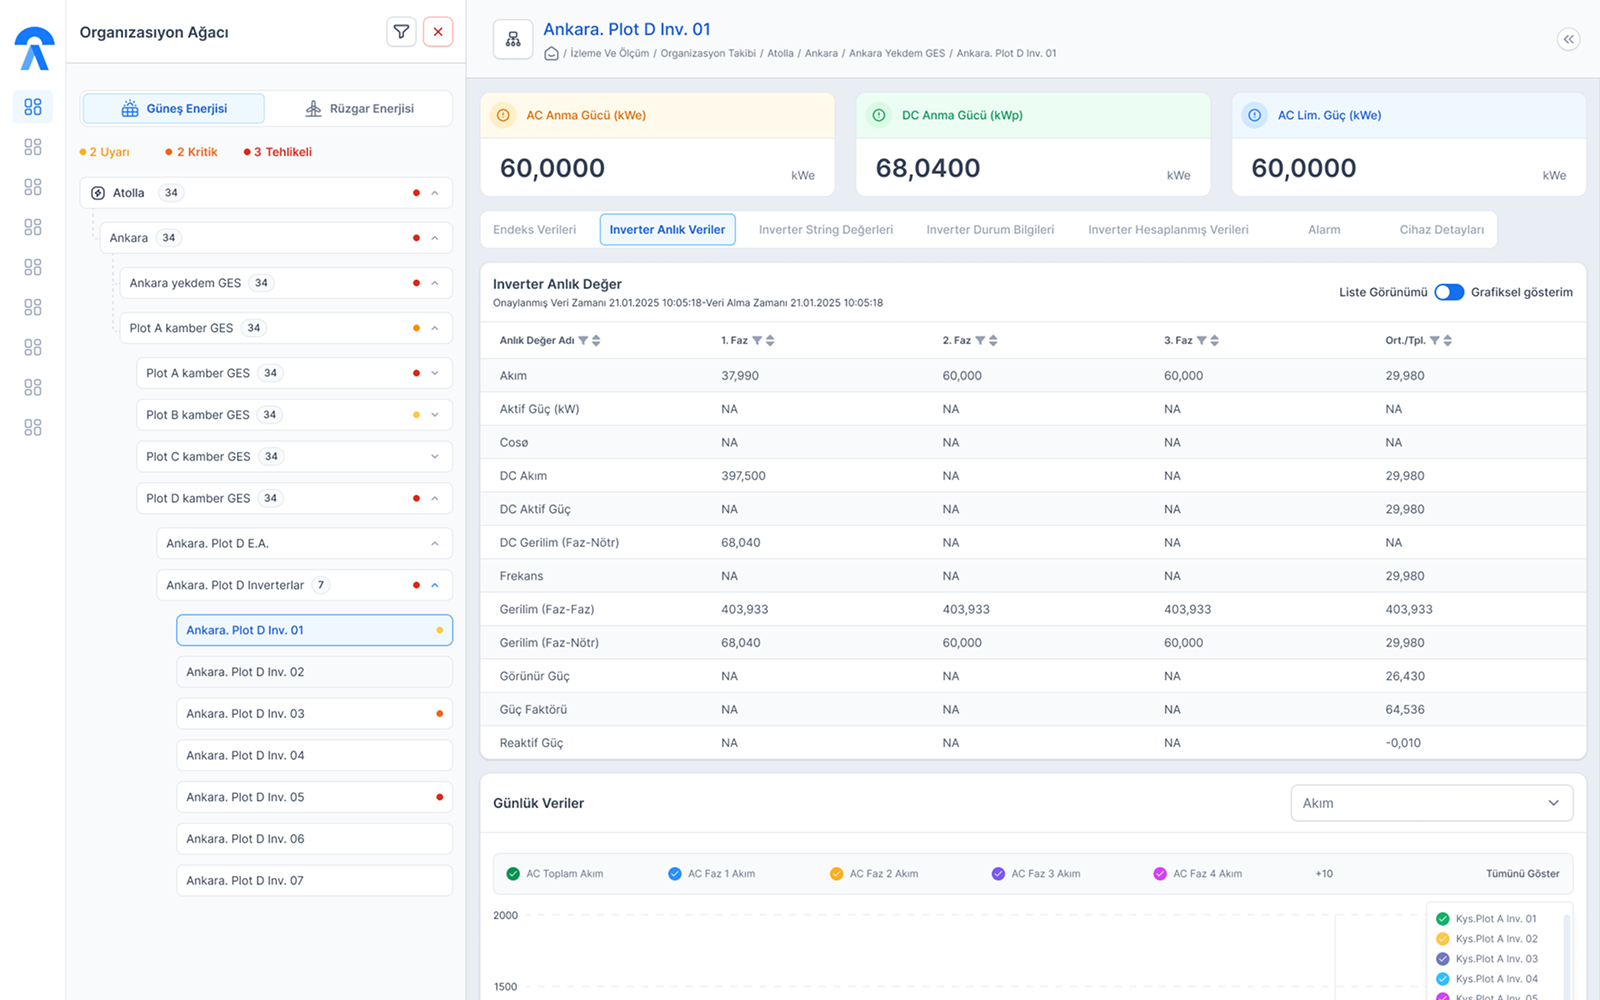
Real-time Monitoring
Granular visibility into energy output across all assets.
Storage Optimization
Intelligent control over battery capacity and energy reserves
Data Scalability
Robust infrastructure capable of managing hundreds of sites
Performance
Optimized data rendering for near-instant dashboard responsiveness
Customer Needs
// section.customer.needs
Design Process
// section.design.process
RESEARCH
Analyzing operator workflows to identify bottlenecks
Information Architecture
Restructuring data hierarchies to reduce time-to-insight
Wireframing
Low-fi sketches, information architecture, user flows
Prebilud Custom Design System
Creating a proprietary UI/Tokens library for consistency
UX/UI Design
High-fidelity mockups, design system, component library
Testing
Usability testing with real technicians and owners
Handoff
Developer specs, annotation, interactive prototypes
The Solution
// section.solution
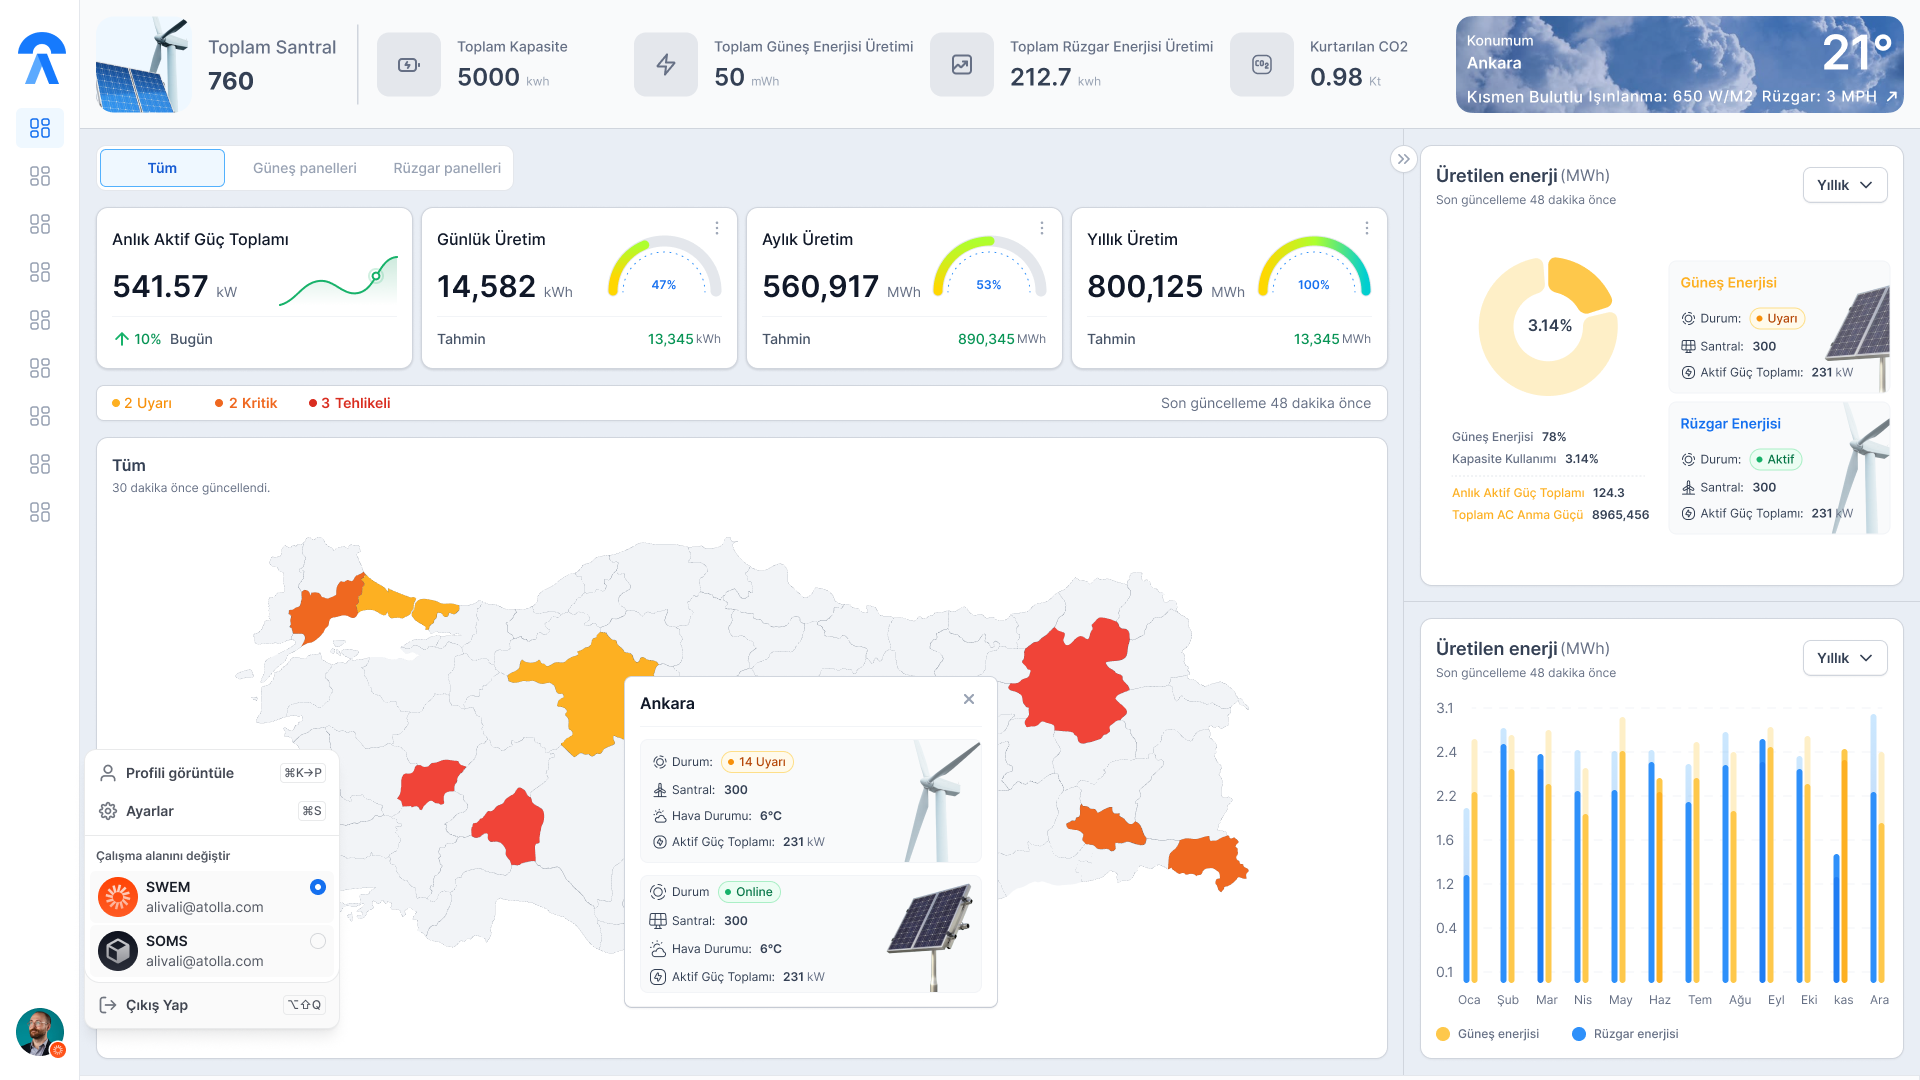
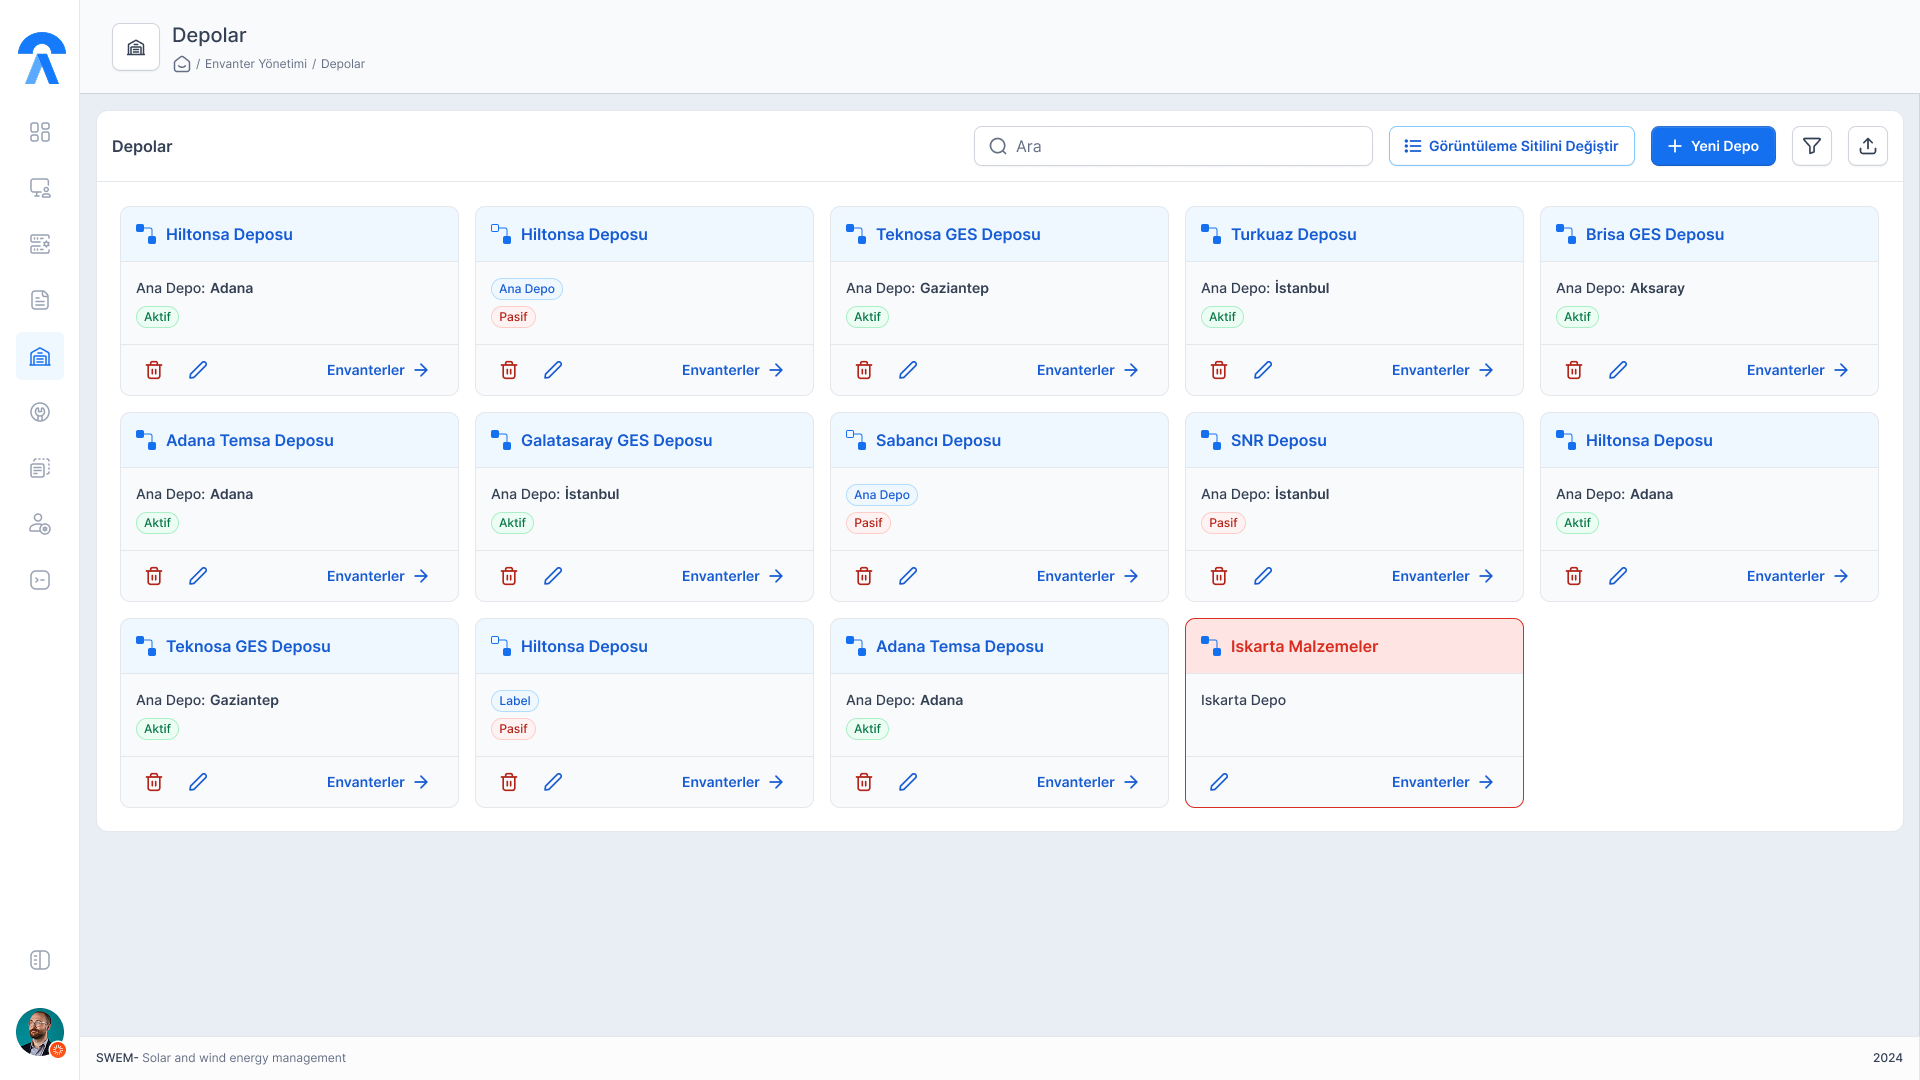
Centralized Control
[01]Unified disparate site data into one actionable command center.
Performance Boost
[02]Reduced main dashboard load time by 70%
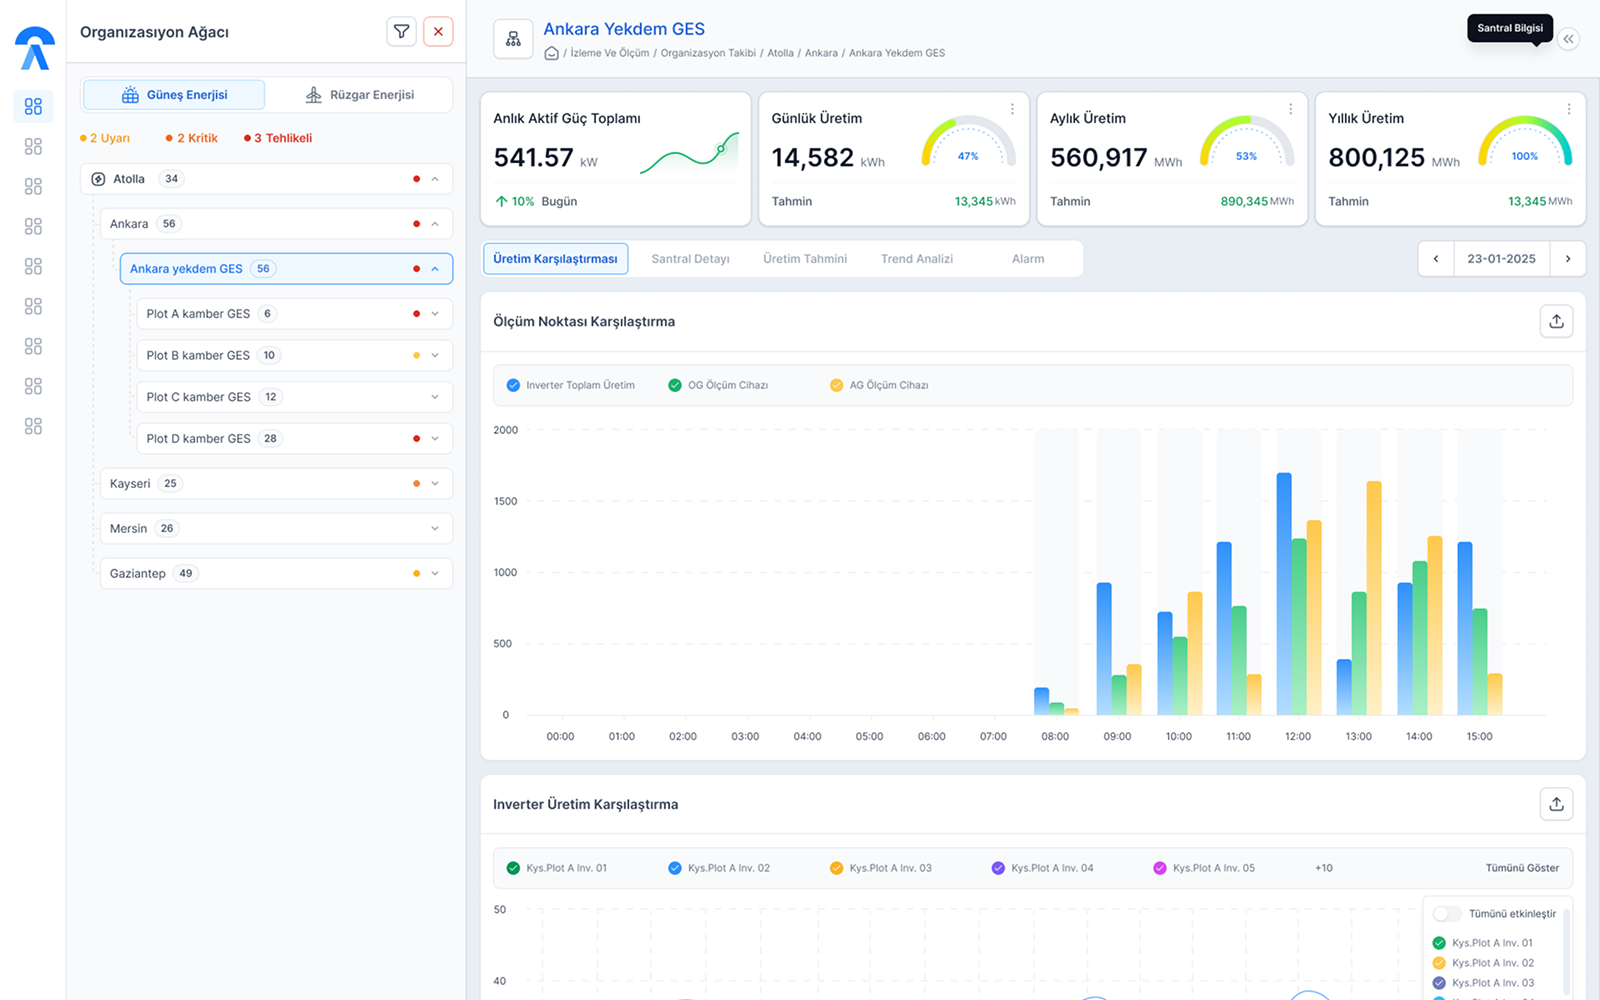
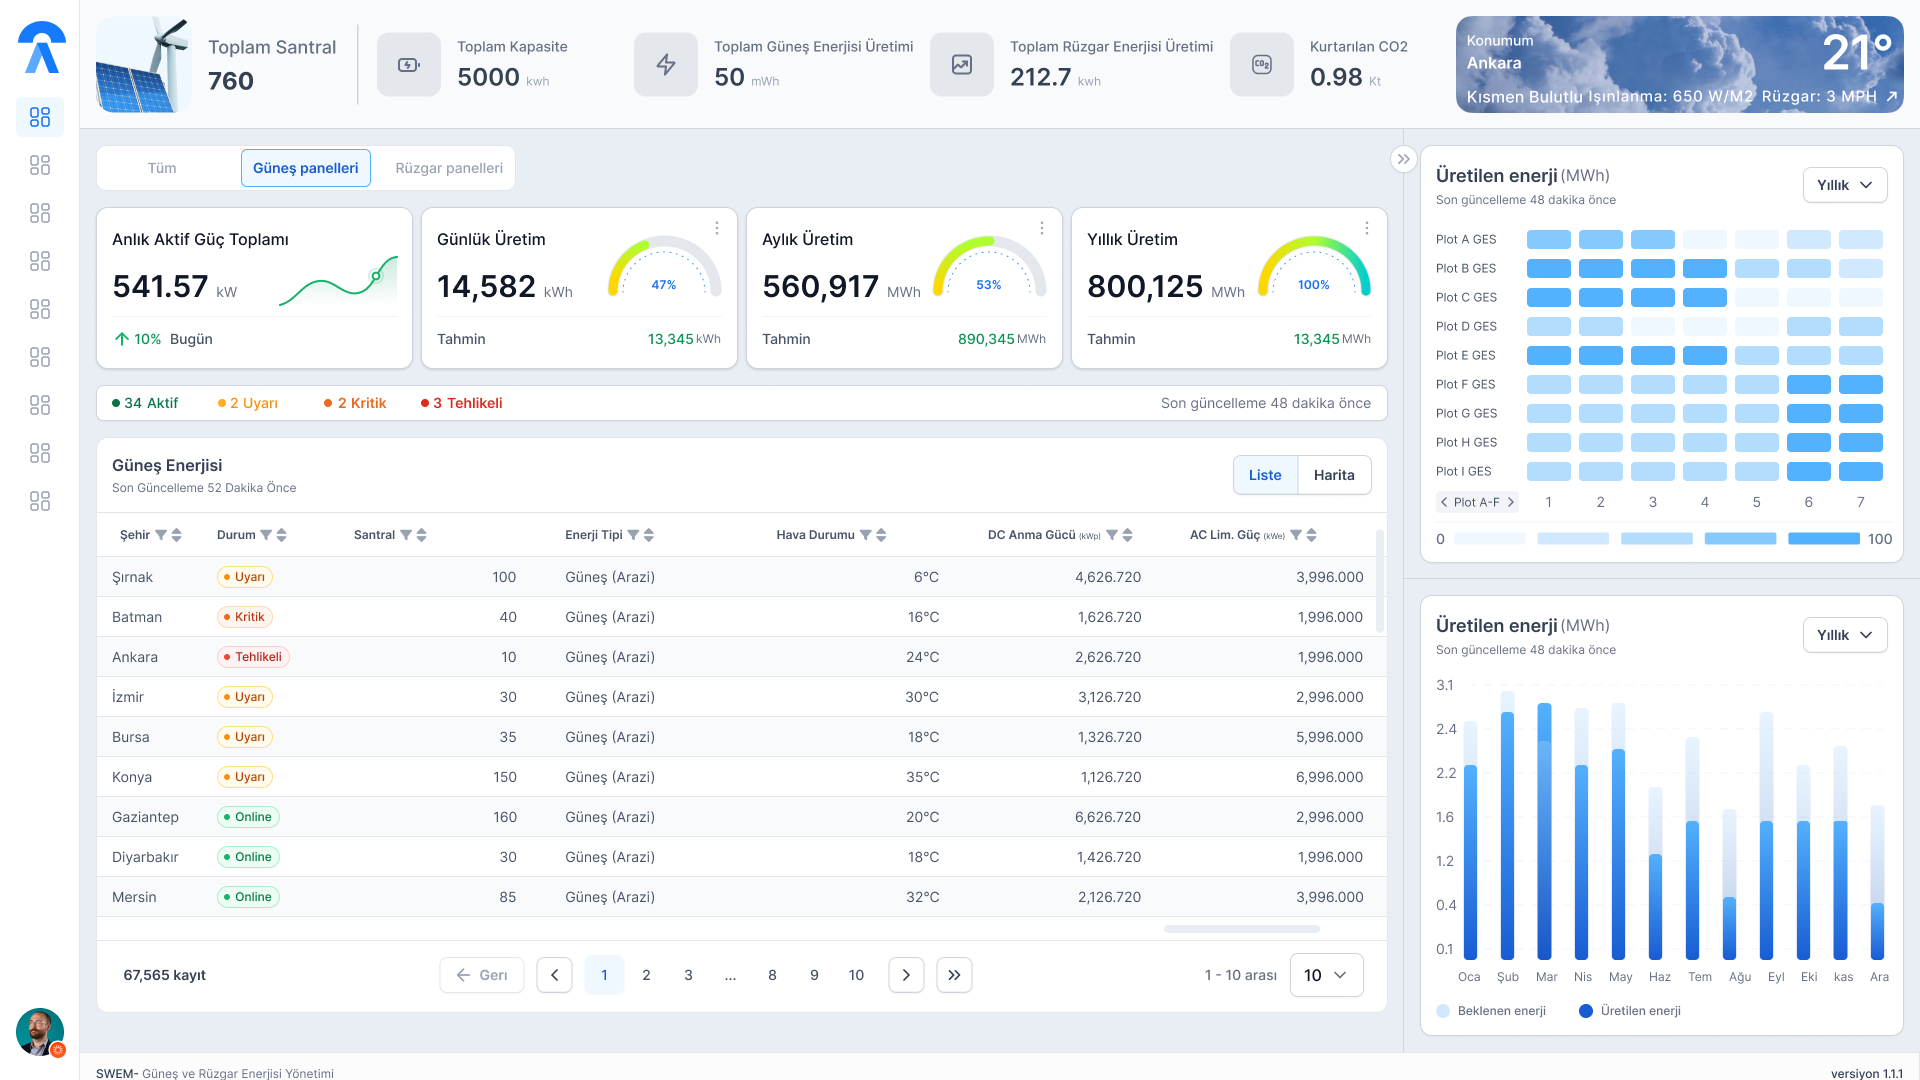
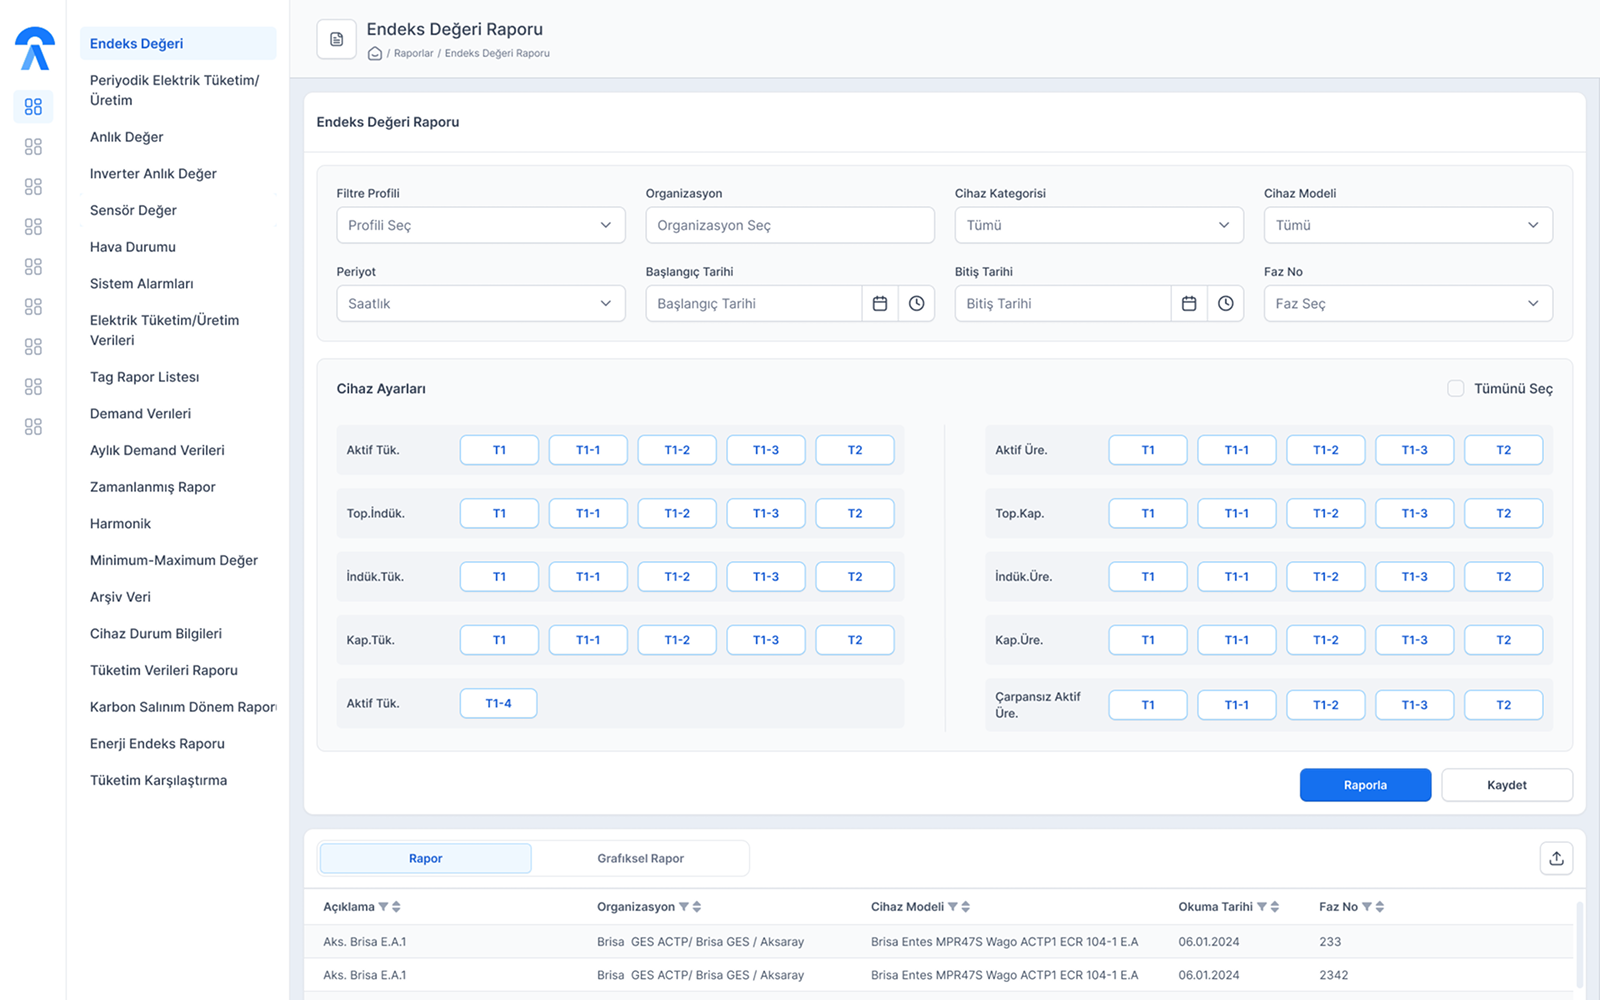
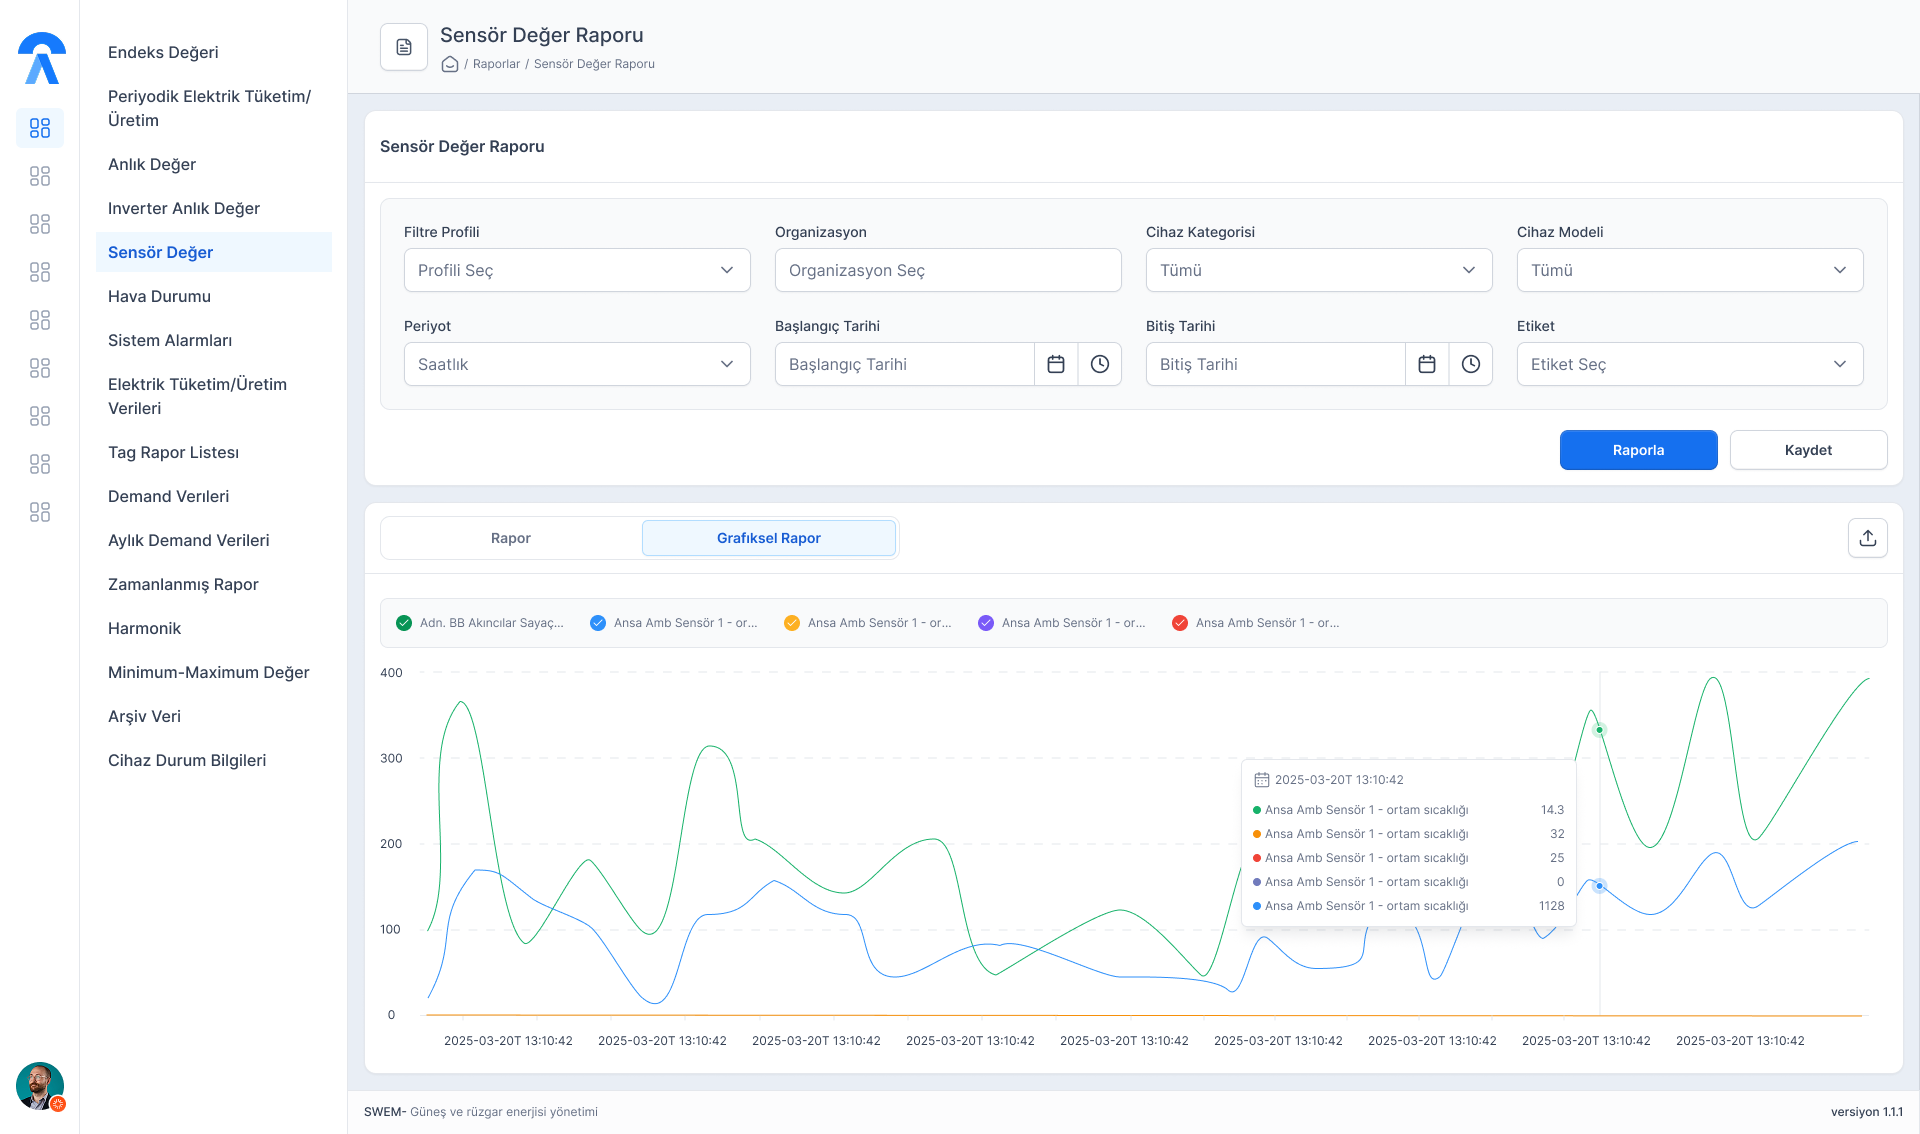
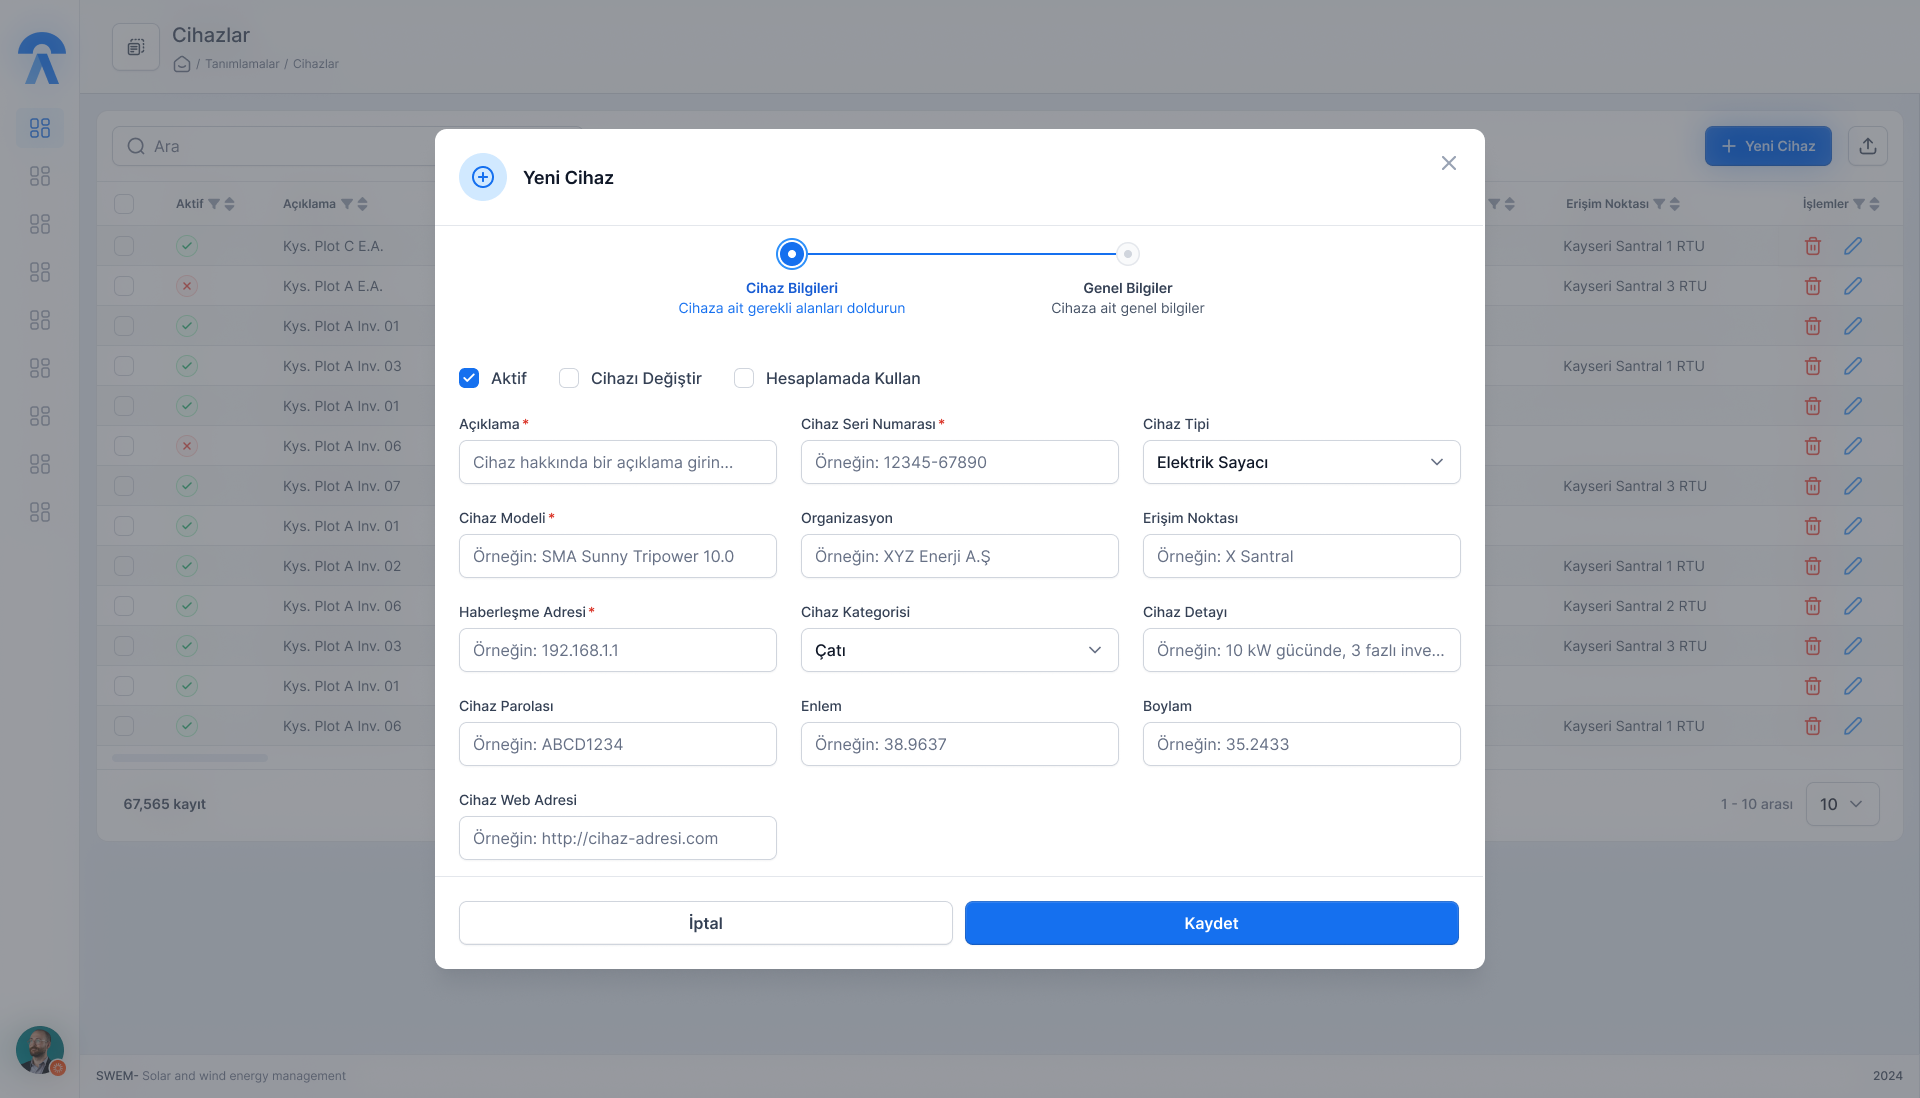
UX Transformation
[03]Transformed complex tables into interactive, easy-to-read charts
Design System
[04]Created a comprehensive design system that ensures consistency and scalability across all products.
Key Screens
// section.key.screens
Learning & Reflections
// section.learning.reflections
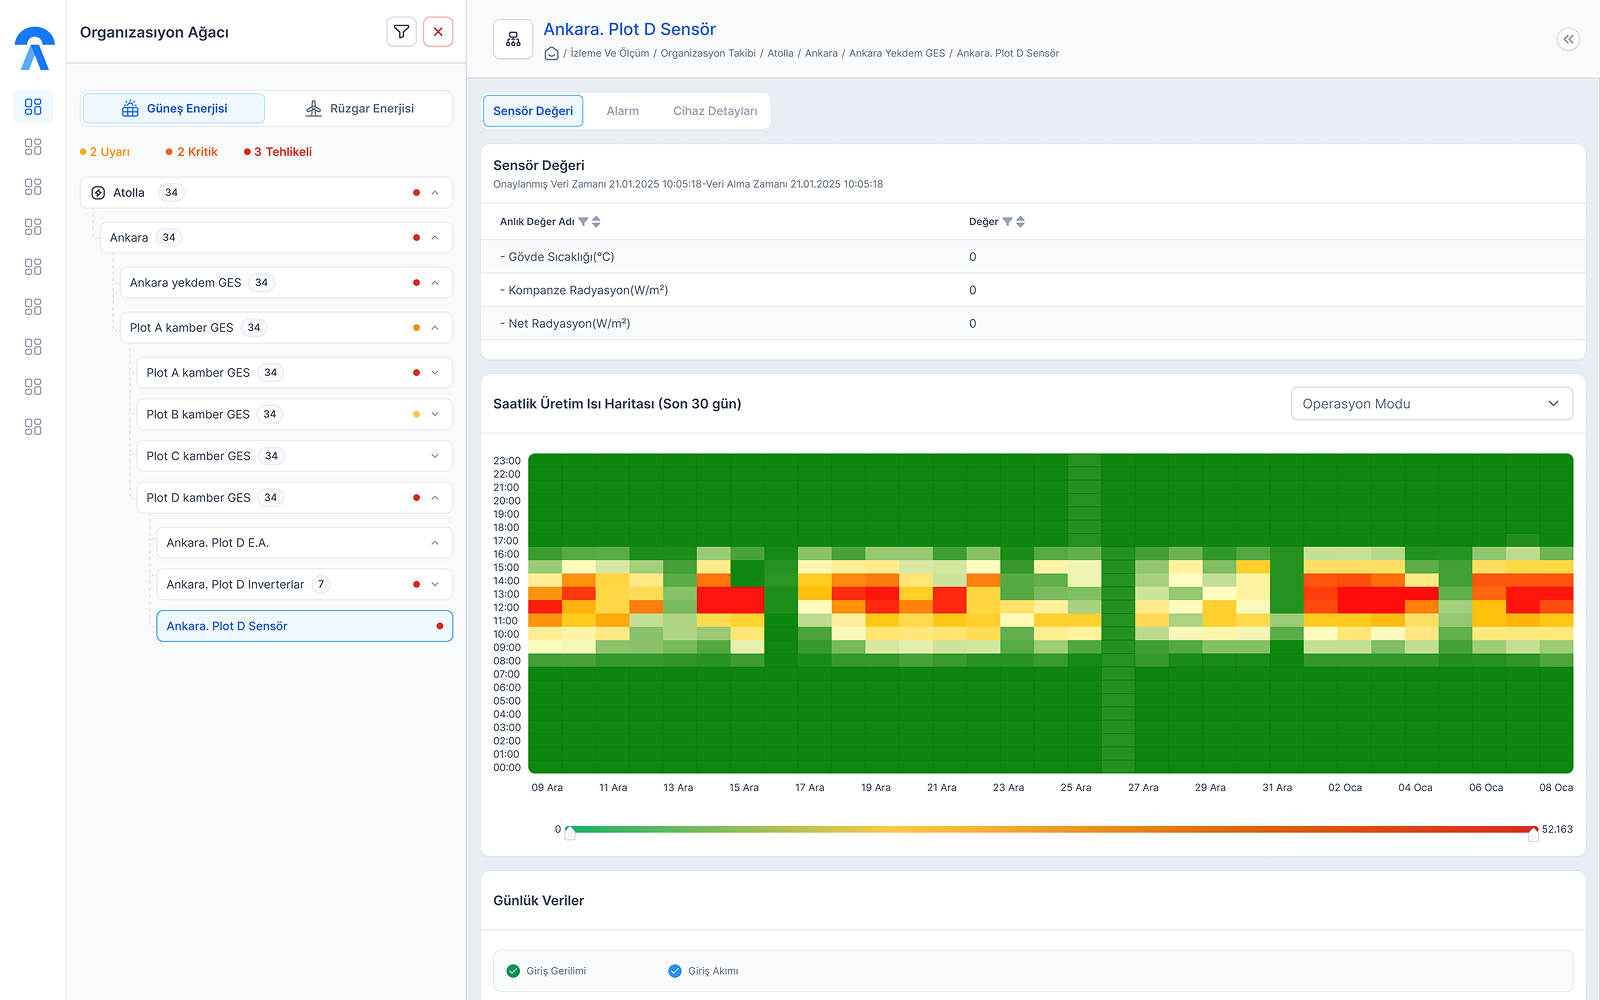
Data-Driven Design
Visualizing complex energy outputs requires deep collaboration with subject matter experts to ensure meaningful data representation
Predictive Alerting
Reducing cognitive load for operators through intelligent, automated alerting is essential for mission-critical reliability
Scalability Thinking
Designing modular components ensures the interface remains consistent and efficient as the system scales across new regions and power plants
Iterative Validation
Real-world feedback loop is vital; continuous testing with technical operators significantly improved the usability of the monitoring dashboard
Next Project
CMS
Product Designer

Let's Talk
Ready to build something great together?
I'm currently available for new opportunities and exciting projects.
Feel free to reach out — I usually reply within 24 hours.